
Do not believe in magic numbers, set the proper value
Those two indicators look very similar and do very similar job – setting the main parameter of the offline chart generator. Though the offline generator runs on an online timeframe chart (feed chart), these two indicators need to be attached to the target offline chart. While there may be multiple generators attached to the feed chart, the offline chart assignment to the particular generator is unanimous.
The goal of using those indicators is getting clearly defined setting for symbols that differ in volume, price or price dynamics. The idea is simple – indicator takes the related value from another timeframe and applies simple calculation to reveal value suitable for the offline chart, which would make the settings independent on a broker volume, symbol dynamics or price level.
The input parameters are chosen to resemble regular timeframe properties. The user selects a period which he likes the offline chart be close to (a bit simplified), then he plans its regular recalculation.
AUTOVOLUME

Input Dialogue for the AutoVolume
Average candle time specifies interval, which you like to have for a single candle in average. It will be calculated from the M1 chart.
Minutes for interval calculation is an interval, which will be taken from the source for calculations.
Minutes to the next refresh is recalculation option, specifying rate of the parameter refresh.
AUTORANGE
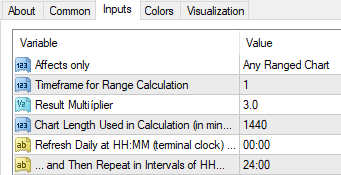
Input Dialogue for AutoRange
Affects only – chart types list. This option is useful only with OmniaBar indicator, when you intend to switch between multiple chart types. You may attach the indicator multiple times, and select different parameters for each chart type. Then the other AutoRange indicators remain inactive, until the chart type matches their entry.
Timeframe for Range calculation – specifies a chart timeframe, that will serve as a source for calculations. It may be any timeframe, including offline timeframes (if active). You should avoid a self-reference though.
Result multiplier – a simple factor to the calculation result for fine range tuning.
Dependency between the timeframe and the range is roughly quadratic, so setting the factor to 2.0 within timeframe H1 gives a very similar result as a factor 1.0 within H4. Factor of 1.4 would be close to H2 range when calculated from H1.
Minutes for calculations – duration (chart lenght), which will be taken as a source for calculations. The most recent period is used.
Refresh daily at – time, when the range update happens. It should happen during a safe period, as changing the entire chart may confuse other indicators and experts!
…and then repeat in intervals – an option, if you want to update the range more than once a day.
Between refreshes, the indicator is inactive, so you may change your parameter by other means meanwhile. The indicator overwrites any data at the next scheduled refresh.
Have you some examples of range calculation, your calc I did not anderstand
I want to understand how I can use these, but I’m totally confused even after reading the instructions several times, please provide a video.
Hello Colin, you may try to watch any of the video in the relevant product pages (Renko, Range Bars etc.), it makes a bit clearer.
Hello Ovo Team,
When i type as the timeframe by the auto range indicator a offlinechart (lets say Tick Chart of M61Chart) and i want that it refreshes everytime when a new candle is builded in the M61 Chart then i need to write by “Minutes to the next refresh” 01:01 (61 minutes)??
i have tried these one but it didnt work
could u pls response to this question
Hello Atila, whatever timeframe you select, there is no relation to closing the candle on the referenced chart, only the time matters.
thanks for your quick reply Milan
Hi Milan,
Am using the charts and results are great!
Wondering if you’d elaborate on the phrase above: “The indicator overwrites any data at the next scheduled refresh” and outline what data exactly is overridden.
Does this mean that the past bars/bricks are adjusted to the new bricks size (say on renko bars) – altering the past chart shape OR just that a new brick size is calculated and used in future bricks from that point forward (till next refresh time)?
Thanks
Hello Richard, it means that the entire chart is reconstructed.
Hi. Is there a way to autoassign the offline charts to all my open (28 FX) online charts?
MT4 enables saving and reusing custom chart templates and profiles (workspaces) if it makes some sense for your intention. Also a custom script could be the solution, but it is not covevered by this site.
I am interested in buying your Tick Chart key. But it needs to be a solution which is manageable. That is, I need to have 28 offline charts open simultaneously. Currently I have scripts which open all charts in Market Watch automatically in one go once I activate that specific script. And I have a script which transfer settings from a giving template to all other charts in one go automatically once I activate that script. So I need some kind of procedure/script/… that attaches/creates your Tick Chart offline charts (semi)automatically. Is this a solution you provide? I have been pointed towards your solutions by an existing user of your tools.
Does this makes sense?
I bought the license for omnia bar. All the features are very good.
but main thing with renko is box size calculation. so if we could have ATR and Percentage LTP option to calculate renko box size in Omnia Bar or with Auto range. it could be more better. I think.
please provide these features, if possible with omnia bar or in auto range.
or if you know any better optimized way to calculate Renko box, please suggest me.
one more thing do we have Omnia Bar for MT5 platform?
Hi Milan
I have bought a Renko license, it’s a great renko generator and stands apart from the others available elsewhere…
But one feature that would greatly enhance its usability is to have a Percentage of LTP for Renko size calculation…
Could you please include the Renko size as Percentage of LTP opton in the Renko generator…?
Please let me know
Thanks a ton…
Best Regards
Mony