What the Docs Read
The original story is available here.
How the Strategy Tester Works
Everyone knows it. Ctrl + R brings the Strategy Tester pane on display, then selecting EA, timeframe and symbol and pressing the Start button. So far it is clear. But what is happening in the terminal then?
The tester tries to fetch as much data as available from the trading server. In case of a single timeframe precision only a single timeframe, otherwise also the all the finer ones.
Then it constructs test data set from the data it received. This set will actually become a file, and you may find it after generation is over, in the <tester/history> folder of your data root (menu item Open Data Folder). The file has an extension FXT (no idea what the letters stand for) and the file life cycle usually ends with the single test run. A new test wipes out the file and rewrites the file by a new generated file over and over.
In addition to the evolving price data for candles, the FXT file contains also symbol and market data fetched from the trading server. They are used in profit calculations. The fact that they are included in the FXT file makes the FXT file autonomous and the Strategy Tester does not need connection to the trading server once the FXT file has been created.
The Spread
The Strategy tester has the spread fixed. The spread is also displayed in the report just below the Modelling Quality number. The original FXT file has only fixed spread handling as it contains only a single price tag for every single tick (no ask, no alternative spread entry). The spread value can be adjusted only before the testing starts (with the standard testing procedure).
This static spread feature is often discussed, as it is quite far from the current reality. Most brokers use variable spreads with every tick, and even their moving average of the spread changes value over trading session, depending on liquidity.
The Modelling Quality
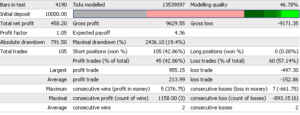
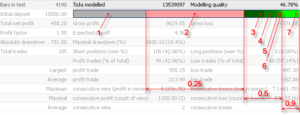
After the test is over, the Tester reports its results. As every one notices, there is a mysterious number named Modelling Quality. Sounds very promising, doesn’t it? Anyway, not many traders know, what the number actually represents, but many consider it as a key number for confirmation of their testing result.
ModellingQuality = ((0.25*(StartGen-StartBar) +
                     0.5*(StartGenM1-StartGen) +
                     0.9*(HistoryTotal-StartGenM1))
                     / (HistoryTotal-StartBar))*100%;
I do not want to dig deep into the formula used by Metaquotes, but the interesting knowledge is the results cannot reach values outside a range from 25% to 90%. So, where do the 99% or 99.9% come from?
Now, I can tell you the truth: the number represents nothing. The number in the report is just a number someone (or something) wrote into the FXT file. Though the tester uses the above (weird) formula, you could replace it by any number, including 99,99% or 0.00%. The strategy tester then may display this number in the result report.
Be smart and avoid using this number as an argument for your performance results, as this number has actually very problematic relation to the model performance. Every time you should judge yourself, how precise your historical data is, and how far your EA is resistant to the degree of intra-candle model quality.
Account base currency rates, commission fees, swap fees
These values are treated in a similar way to the spread. Though the FXT file contains those values, they are constants over the entire testing period and they are actually the most recent values, rather than the average.
Positive & negative slippage, connection drop-out, broker issues
Those parameters are completely neglected in the tester, but everyone knows they may have huge impact on some strategies. The only way you may somehow include their impact into calculations is slightly increasing your static spread.


Hi,
“In the oncoming post we will keep an eye on the “99%” data testing” where i can find this post?
Thanks in advance,
Riccardo