window.dataLayer = window.dataLayer || []; function gtag(){dataLayer.push(arguments);} gtag('js', new Date()); gtag('config', 'UA-30149564-2');

admin

About Milan

A JAVA architect and developer of numerous projects in avionics, telecommunications and banking sector in Germany, UK and Denmark. Currently he focuses on development of additions for retail trading platforms. Most of time he lives in Prague, the Czech Republic.
My other nick is Ovo.

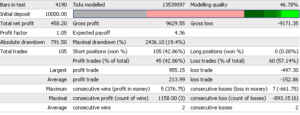
Backtesting in MT4 – What Matters

What the Docs Read The original story is available here.

report model Test Report How the Strategy Tester Works Everyone knows it. Ctrl + R brings the Strategy Tester pane on display, then selecting EA, timeframe and symbol and pressing the Start button. So far it […]

2016-10-16T18:53:53+01:00March 13th, 2016|Categories: Tips & Tricks|1 Comment

February 2016 USA market view

Fig. 1 – Daily Candlestick chart of ELMD. It went up 183% from US$1.72 to $4.87.

STOCKS. The best three stocks in the 1-month category are ELMD @ 183%, HMY @ 82% and SBGL @ 62%.

A stock trading on NYSE MKT, ELMD belongs […]

2016-10-16T18:53:54+01:00March 1st, 2016|Categories: John Craciun Analysis|0 Comments

Flex Renko Can Render Other Renko Types

The Flex Renko chart type, embedded in the OmniaBar indicator, can actually render several other Renko derivatives, just by setting its parameters to specific values. Renko (with wicks)

Settings for the Renko chart Settings for the Renko chart

This settings reflect the Renko 100-point (10-pip on a […]

2016-10-16T18:53:54+01:00February 25th, 2016|Categories: Tips & Tricks|4 Comments

January 2016 USA Market View

Fig. 1 – Daily Candlestick chart of DRD. It went up 65% from US$1.70 to $2.80.

STOCKS. The best three stocks in the 1-month category are DRD @ 65%, SPKE @ 25% and MBTF @ 23%.

A stock trading on NYSE, DRD belongs to […]

2016-10-16T18:53:54+01:00February 2nd, 2016|Categories: John Craciun Analysis|0 Comments

Version 210.005 Released, With 4-Digit Tick Chart Option

Parameters list is changing. Your current indicator settings gets reset after update! This 210.005 update adds a new parameter “Degrade decimal resolution” to Flexi Bars and Tick Bars. (Also available in OmniaBar). Does not apply to other chart generators.

The parameter is not accessible from the remote, and it must be set in the generator inputs.

When on, the charts (tick chart or flexi timeframe) drop […]

2016-10-16T18:53:54+01:00January 25th, 2016|Categories: Software Updates|1 Comment

Messages in Experts Log – What Do They Mean?

This entry about messages supposes you have set your Data Consistency Warnings input to ‘verbose’.

Actually I got very few queries about the messages appearing in the Experts Log. So here is how they are generated and what you should do to get rid of them.

Typical output to Experts Log with multiple indicator deployment may look like this […]

2020-04-01T10:35:42+01:00January 19th, 2016|Categories: Tips & Tricks|1 Comment
Go to Top